Using Shiny Server Open Source? Want to see how many people are using your apps? This post will walk through how to set up a simple Shiny app to monitor the number of users on your Shiny Server.
Know thyself
Keeping track of the number of users on your Shiny Server is helpful for several reasons: * Identifies low-traffic periods (best times to push updates or restart the server) * Tells you if you need to pay more attention to scaling your apps (i.e. adjust server size, optimize slow apps) * Shows which apps are most popular
Basic architecture
- Deploy Shiny Server Open Source with one or more apps
- Continuously check your server’s logs and save off data on the number of users on each app
- Build Shiny app to display the data over time
Step 1: Deploy shiny server with one or more apps
This solution is specifically built for Shiny Servers deployed on Ubuntu EC2 instances from AWS, but the same idea can be applied to other setups with minimal tweaking. See this post for a walkthrough on how to deploy shiny server with AWS.
Once you have your server deployed, create a new directory in the same place as your other apps. This is where we’ll store the server logs and put the app to display the usage data.
dir.create("/srv/shiny-server/server_status")
setwd("/srv/shiny-server/server_status")
Step 2: Continuously check your server’s logs and save off data on the number of users on each app
This is the meat of the whole process. The main idea is to read the server logs into R and parse the number of active users into an .RData file, then repeat…forever. We’ll use check_server.R (code borrowed from this blog post) to accomplish this task.
check_server.R
setwd("/srv/shiny-server/server_status")
RData <- "sysLoad.RData"

if (!file.exists(RData)) {
  Dat <- NULL
} else {
  load(RData)
}

I <- 0

repeat {
  system("top -n 1 -b -u shiny > top.log")
  dat <- readLines("top.log")
  id <- grep("R *$", dat)
  Names <- strsplit(gsub("^ +|%|\\+", "", dat[7]), " +")[[1]]
  if (length(id) > 0) {
    # 'top' data frame;
    L <- strsplit(gsub("^ *", "", dat[id]), " +")
    dat <- data.frame(matrix(unlist(L), ncol = 12, byrow = T))
    names(dat) <- Names
    dat <- data.frame(Time = Sys.time(), dat[, -ncol(dat)], usr = NA, app = NA)
    dat$CPU <- as.numeric(as.character(dat$CPU))
    dat$MEM <- as.numeric(as.character(dat$MEM))
    # Check if connection number changed;
    for (i in 1:length(dat$PID)) {
      PID <- dat$PID[i]
      system(paste("sudo netstat -p | grep", PID, "> netstat.log"))
      system(paste("sudo netstat -p | grep", PID, ">> netstat.log2"))
      system(paste("sudo lsof -p", PID, "| grep /srv > lsof.log"))
      netstat <- readLines("netstat.log")
      lsof <- readLines("lsof.log")
      dat$usr[i] <- length(grep("ESTABLISHED", netstat) & grep("tcp", netstat))
      dat$app[i] <- regmatches(lsof, regexec("srv/(.*)", lsof))[[1]][2]
    }
    if (!is.null(Dat)) {
      dat.a <- Dat[which(Dat$Time == max(Dat$Time)),]
      con.a <- dat.a$usr[order(dat.a$app)]
      con.b <- dat$usr[order(dat$app)]
      if (paste(con.a, collapse = "") == paste(con.b, collapse = "")) {
        changed <- FALSE
      } else {
        changed <- TRUE
      }
    } else {
      changed <- TRUE
    }
    # Keep only the lines containing important information to same storage space;
    if (any(dat$CPU > 5) | any(dat$MEM > 50) | changed) {
      Dat <- rbind(Dat, dat)
      Dat <- Dat[which(Dat$Time > (max(Dat$Time)-30*24*60*60)), ]
      save(Dat, file = RData)
    }
  }
  Sys.sleep(5)
  I <- I + 5
  if (I >= 60) {break}
}
This will run every 5 seconds for one minute. To run in perpetuity, set up a cron to run this every minute. First, open up your crontab file:
crontab -eThen add this line to the end of the file:
* * * * * sudo /usr/bin/Rscript /srv/shiny-server/server_status/check_server.RNow you’ll have data on your users henceforth! Open the .RData file in R to check out the dataframe.
load('sysLoad.RData')
head(Dat)
                 Time   PID  USER PR NI   VIRT   RES  SHR S  CPU MEM    TIME usr                        app
1 2018-03-09 22:01:01 23290 shiny 20  0 293872 98472 9480 S  0.0 4.8 0:02.93   1 shiny-server/server_status
2 2018-03-09 22:01:17 23290 shiny 20  0 293872 98472 9480 S  0.0 4.8 0:02.96   0 shiny-server/server_status
3 2018-03-09 22:22:27 24511 shiny 20  0 258208 79728 7388 R 98.8 3.9 0:01.31   0       shiny-server/sentify
4 2018-03-09 22:53:17 26042 shiny 20  0 297064 98272 8180 R 52.7 4.8 0:02.62   1       shiny-server/sentify
5 2018-03-09 22:53:22 26042 shiny 20  0 297204 98492 8260 S  0.0 4.8 0:02.91   0       shiny-server/sentify
6 2018-03-09 23:52:58 29000 shiny 20  0 245316 78764 6808 R 98.7 3.8 0:01.12   0       shiny-server/sentify
Step 3: Build shiny app to display the data over time
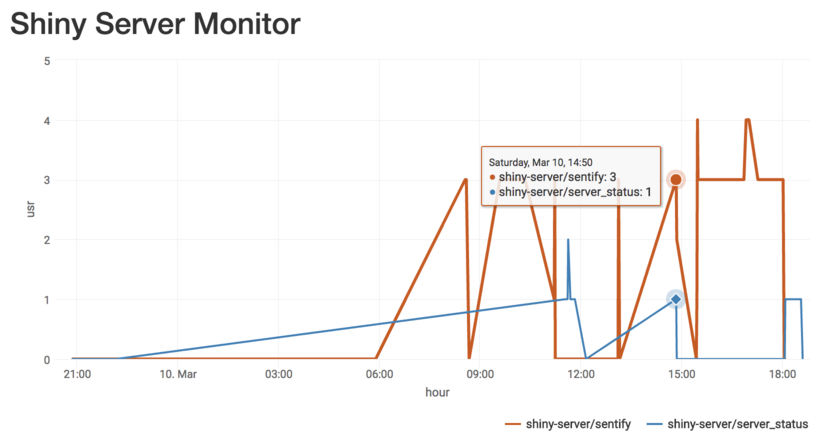
For me, the most helpful data has been the raw user counts, but there’s also CPU and Memory data in the logs. I’ve kept it really simple and am just displaying the user count data from “today” by minute for each app, but obviously there are a bunch of other ways this data could be used.
app.R
library(shiny)
library(tidyverse)
library(lubridate)
library(highcharter)

ui <- fluidPage(
    titlePanel('Shiny Server Monitor'),
    highchartOutput('user_chart_today')
)

server <- function(input, output, session) {

    filter_user_data_today <- reactive({
        load('sysLoad.RData')

        Dat %>%
            mutate(hour = as.POSIXct(trunc(Time, 'mins'))) %>%
            filter(hour >= as.Date(Sys.time())) %>%
            group_by(hour, app) %>%
            filter(Time == max(Time)) %>%
            slice(1) %>%
            ungroup %>%
            arrange(hour) %>%
            mutate(hour = datetime_to_timestamp(hour))
    })

    output$user_chart_today <- renderHighchart({
        filter_user_data_today() %>%
            hchart(hcaes(x = hour, y = usr, group = app), type = 'line') %>%
            hc_xAxis(type = 'datetime') %>%
            hc_tooltip(shared = TRUE) %>%
            hc_add_theme(hc_theme_smpl())
    })

}

shinyApp(ui = ui, server = server)
I hope this has been helpful! To get started yourself you can pull the app and log parsing script from github). You can also go here to see a live example.